Statistics Overview
Summary
This page explains how to analyze campaign performance using DAO.AD statistics, reports, charts, and filters.
Before You Begin
- Role: Advertiser
- Estimated time: 2 minutes
Steps
- Open the Statistics section from the top navigation menu and select the desired ad format.

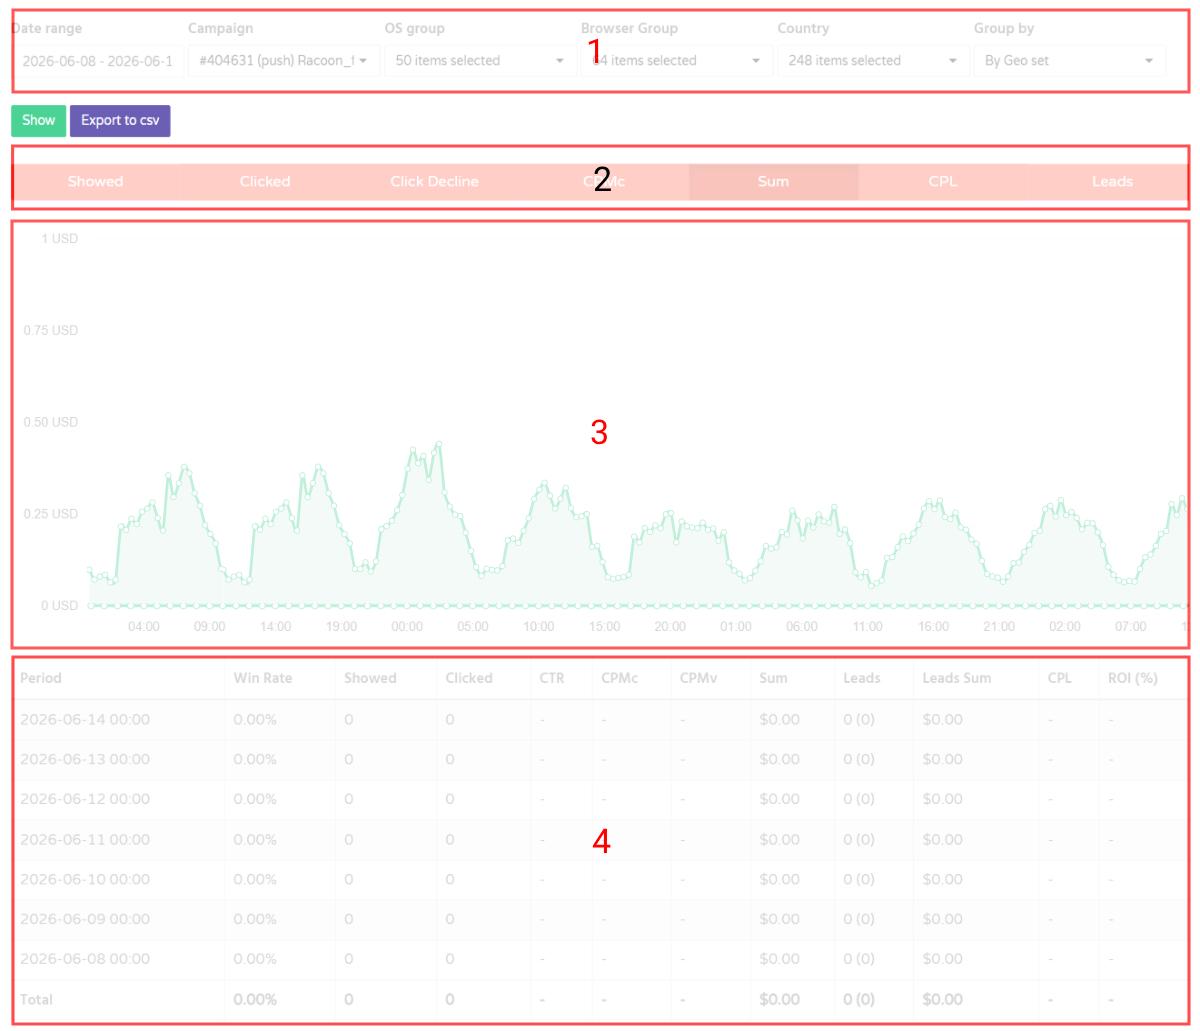
- The Statistics page is divided into four main sections:
Filters (1), KPI metrics (2), Performance Charts (3), and the Data Table (4).
- Use the filters to select a date range and refine your report by campaign, operating system, browser, country, or other available dimensions.
- Use the Group By option to view performance data by day, hour, GEO set, browser, and other categories.