Reporting
Statistics Overview
Summary
This page explains how to analyze campaign performance using DAO.AD statistics, reports, charts, and filters.
Before You Begin
- Role: Advertiser
- Estimated time: 2 minutes
Steps
- Open the Statistics section from the top navigation menu and select the desired ad format.

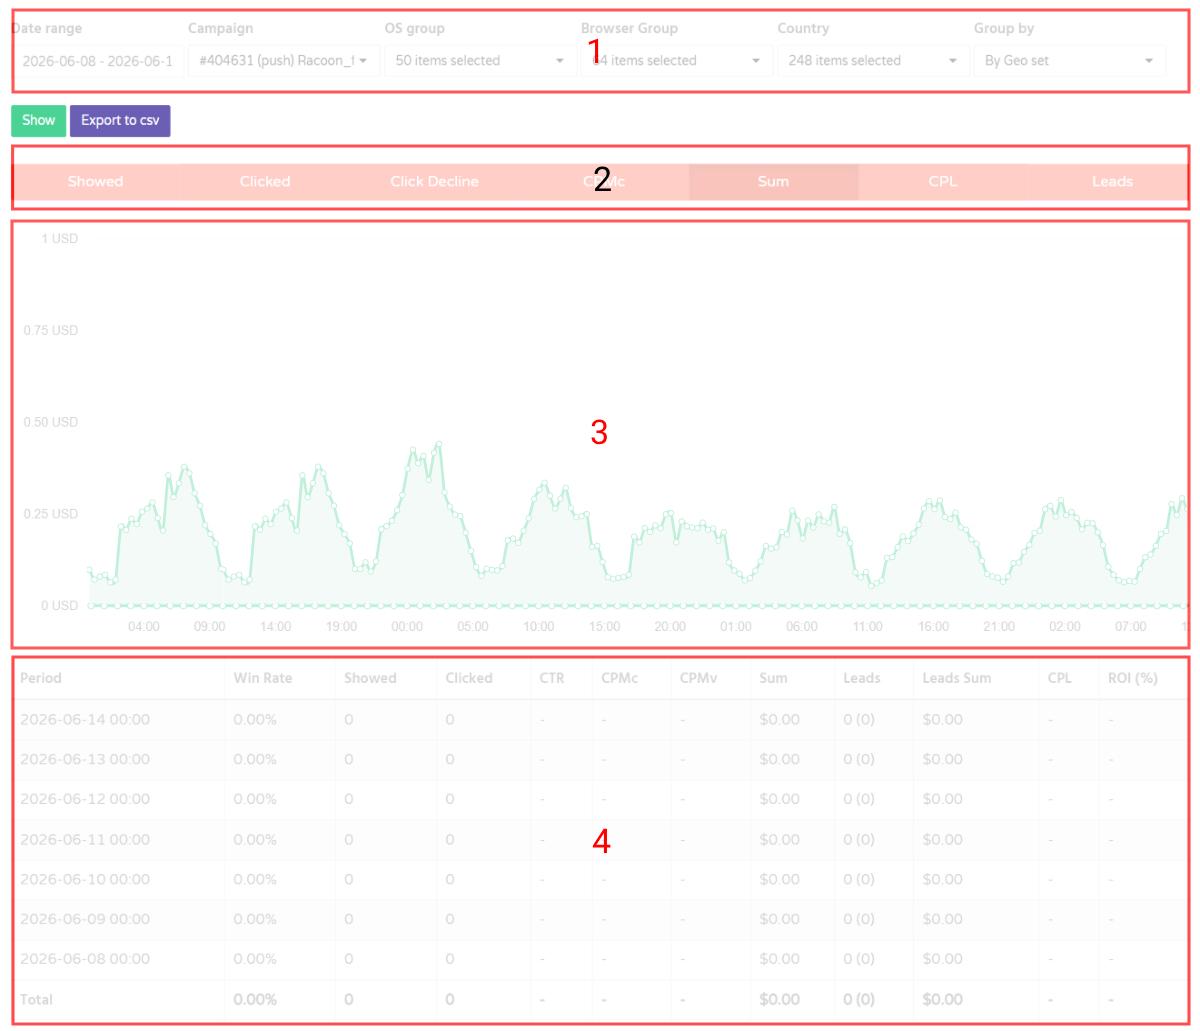
- The Statistics page is divided into four main sections:
Filters (1), KPI metrics (2), Performance Charts (3), and the Data Table (4).
- Use the filters to select a date range and refine your report by campaign, operating system, browser, country, or other available dimensions.
- Use the Group By option to view performance data by day, hour, GEO set, browser, and other categories.
Related
Statistics KPI
Summary
This page provides an overview of statistics filters, grouping options, and KPI metrics available in DAO.AD.
Before You Begin
- Role: Advertiser
- Estimated time: 2 minutes
Steps
- Open the Statistics section from the top navigation menu and select the desired ad format.
- The following filters are available:
a. Date range - Filter statistics by a selected date range. The maximum available reporting period is 60 days.
b. Campaign - Filter statistics for a specific campaign.
c. OS group - Analyze performance by operating system.
d. Browser Group - View statistics grouped by browser type.
e. Country - View performance data by country.
f. Group by - Available grouping options:
- by hours - Displays statistics grouped by hour within the selected date range.
- by days - Displays statistics grouped by day.
- by month - Displays statistics grouped by month.
- by countries - Aggregates statistics by country.
- by geo set - Aggregates statistics by GEO set.
- by creative - Aggregates statistics by creative.
- by campaign - Aggregates statistics by campaign.
- by browsers - Aggregates statistics by browser.
- by browser family - Aggregates statistics by browser family.
3. The report table contains the following KPI Definitions:
- Period - dates and hours
- Win Rate – percentage of auction wins compared to total bidding opportunities.
- Showed - Total number of ad impressions served.
- Clicked - Total number of clicks received.
- CTR – percentage of impressions that resulted in a click.
- CPMc - Average cost per 1,000 clicks.
- CPMv - Average cost per 1,000 impressions.
- Sum - Total advertising spend for the selected reporting group.
- Lead - Total number of conversions. Postback tracking must be configured.
- Leads sum - Total revenue generated from recorded conversions.
- CPL - Average cost per lead.
- ROI (Return on Investment) – profitability percentage based on advertising spend and conversion revenue.
Related
- Statistics Overview
- Export Reports to CSV
- Micro-bidding Tool
- Automatic Rules for Blacklisting
- Statistics Overview
Export Reports to CSV
Summary
Learn how to export campaign statistics from DAO.AD into a CSV file for reporting and optimization purposes.
Exported CSV files can be used for offline reporting, campaign analysis, custom dashboards, and data processing in tools such as Microsoft Excel, Google Sheets, or BI platforms.
Before You Begin
- Role: Advertiser
- Estimated time: 2 minutes
Steps
- Open the Statistics section from the top navigation menu and select the desired ad format.
- Apply the desired filters, date range, and grouping options.
- Click the Export to CSV button located next to the filter section.

- Select the preferred export options. Select Separator and Encoding and click Export to csv
